Spreading sustainable Christmas cheer: Paper cards or e-cards?
A comparative Product Carbon Footprint by thinkstep-anz shows that an e-card has a much lower carbon footprint than a paper card.
The functional unit: one greeting card (paper and electronic)
The methodology: Product Carbon Footprint (PCF)
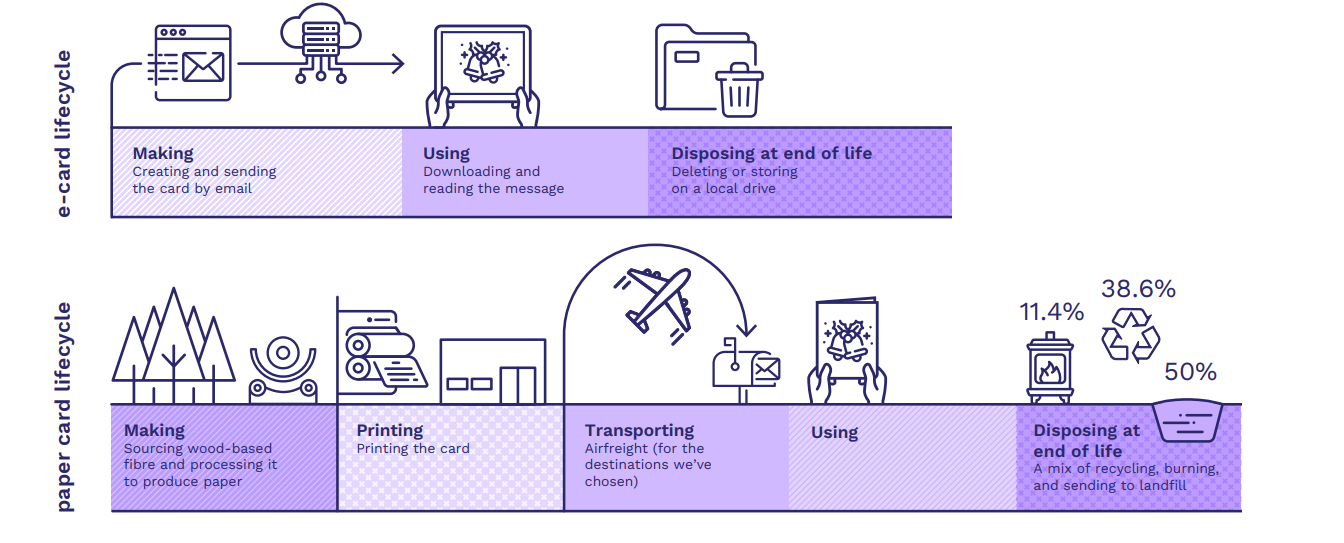
thinkstep-anz looked at every stage of the cards’ lifecycles and compared the two options.
The data: The data was sourced from existing studies.
The environmental impact: The climate change impact was calculated using the Global Warming Potential (GWP), a technical term for a carbon footprint. GWP is measured in carbon dioxide equivalents (CO2e). It sums the total greenhouse gases (GHGs) that the cards emit into the atmosphere during their life cycles.
What they found
1. The carbon footprints differ a lot. The paper card has a much bigger carbon footprint than the e-card.
2. The carbon ‘hotspots’ are different. A hotspot is a major source of GHG emissions. With the paper card, transport’s the culprit. For the e-card, it’s the electricity needed to create the card and use it.
3. Location matters for both cards – for different reasons. Sending a paper card? The ‘from and to’ spots on the globe decide the air miles your card will travel.
Pressing the send button on an e-card? How the electricity is generated at both ends is what matters most. Aotearoa New Zealand has a national grid that produces mostly renewable electricity. In Australia, the USA, and the UK, different states or regions generate electricity in different ways, so the amount of renewable electricity varies. Singapore produces only a tiny amount of renewable electricity.
To read more or access the case study PDF, click here.